A. My predictions where pretty darn close when i was watching the video for the first time i paid attention the the clock and the feet the board went.
B. The zeros represent the start of the skate board rolling of the ramp.
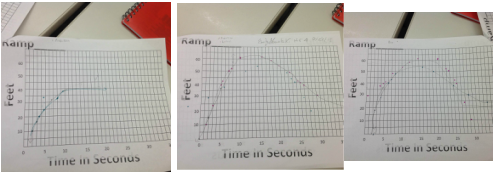
C.The one thing that the three graphs have in common, in the beginning when the skate board rolled of the ramp had the most power which means the graphs shot up in the beginning to also the fall was similar all of them ended up having a fall.
D. When the graphs rising the fastest it means the start of the fall of the ramp same as when they fall.
B. The zeros represent the start of the skate board rolling of the ramp.
C.The one thing that the three graphs have in common, in the beginning when the skate board rolled of the ramp had the most power which means the graphs shot up in the beginning to also the fall was similar all of them ended up having a fall.
D. When the graphs rising the fastest it means the start of the fall of the ramp same as when they fall.
 RSS Feed
